What Is VWAP? Volume-Weighted Average Price
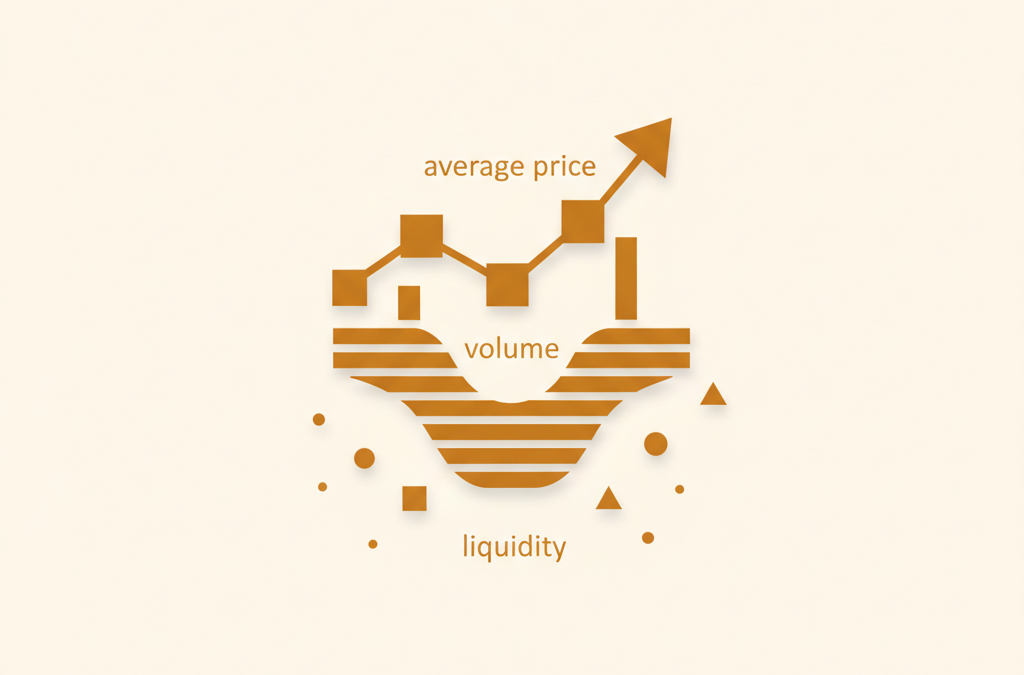
VWAP is the average price an asset traded at over a session, weighted by volume, used as a benchmark for execution quality.
Mechanics, not signals. This explains how a market feature works. It is not a trading strategy, entry, target, or recommendation to buy or sell anything.
Quick answer
VWAP, or volume-weighted average price, is the average price at which an asset has traded during a session, weighted by the volume done at each price. It is calculated by dividing the cumulative value traded (price multiplied by volume) by the cumulative volume, and it resets at the start of each trading day. Traders use it as a benchmark, not a signal.
Key points
- VWAP stands for volume-weighted average price and equals cumulative (price x volume) divided by cumulative volume over a period.
- The calculation weights each traded price by how much volume changed hands there, so busy price levels count more than quiet ones.
- VWAP is typically an intraday measure that resets at the open of each new session.
- It is widely used as an execution benchmark: filling above VWAP is generally worse for a buyer, below VWAP is generally better.
- TWAP (time-weighted average price) is a related benchmark that weights by time rather than volume.
- VWAP is descriptive rather than predictive, so it is a reference point and not trading advice.
VWAP, short for volume-weighted average price, is the average price at which an asset has traded over a period, with each price weighted by the volume that changed hands there. It is calculated by dividing the total value traded by the total volume traded, and on most charts it resets at the start of each session. This article explains how the measure is built and what it is used for; it describes mechanics only and is not trading advice.
What does VWAP mean?
VWAP reflects the typical price of an asset across a session, adjusted so that prices with more trading activity carry more weight. Unlike a simple average of quoted prices, it accounts for both price and volume. That makes it a realistic picture of where the bulk of trading actually occurred, rather than where prices merely touched.
The measure applies to any asset with price and volume data, including stocks, indices, exchange-traded funds, futures, commodities and cryptocurrencies. It is most commonly plotted as a single line on an intraday chart.
How is VWAP calculated?
The formula is cumulative (price x volume) divided by cumulative volume. In practice, a platform multiplies the price of each trade (or each bar’s typical price) by the volume at that price, adds those products together across the session, and divides by the total volume traded so far.
Because it is cumulative, VWAP builds up as the day progresses and settles as more volume accumulates. At the start of a session the figure moves quickly on light volume; by the afternoon it is anchored by the day’s activity and changes more slowly. Standard intraday VWAP then resets when the next session opens.
A worked illustration helps. If 100 units trade at 10 and 300 units trade at 11, the value traded is (100 x 10) + (300 x 11) = 1,000 + 3,300 = 4,300, and total volume is 400. VWAP is 4,300 divided by 400, or 10.75. Note that the figure sits closer to 11 than to 10 because far more volume changed hands at the higher price.
What is the difference between VWAP and TWAP?
The key distinction is what each measure weights by. VWAP weights prices by traded volume, so heavily traded prices dominate. TWAP, or time-weighted average price, weights by time, treating each interval equally regardless of how much volume traded in it.
| Feature | VWAP | TWAP |
|---|---|---|
| Weighting basis | Traded volume | Time intervals |
| Reflects volume spikes | Yes | No |
| Complexity | Higher | Lower |
| Often preferred in | Active, high-volume sessions | Thin or low-liquidity markets |
| Common use | Execution benchmark, fair-value gauge | Spreading activity evenly over time |
Both are benchmarks rather than forecasts, and both are also used to name execution algorithms that try to fill large orders close to the respective average. A VWAP algorithm concentrates activity when volume is high; a TWAP algorithm slices an order into equal pieces over a set window.
Why do traders and institutions use VWAP?
The most common use is measuring execution quality. Large institutional orders can move a market, so desks compare their actual fill prices with the session VWAP to judge whether they traded better or worse than the market average. For a buyer, filling below VWAP is generally considered favourable; for a seller, filling above it is generally considered favourable.
VWAP also serves as a rough fair-value reference during the day. Because it summarises where most volume occurred, participants treat it as a neutral yardstick for the session. Automated execution systems reference it too, adjusting how aggressively they trade so that a completed order lands near the day’s VWAP.
What are the limitations of VWAP?
VWAP is descriptive, not predictive. It tells you where trading has already happened, so it necessarily lags real-time price and says nothing on its own about what comes next. Reading direction into it is a strategy choice that lies outside the mechanics covered here.
The intraday version also carries a lag that grows through the day: as cumulative volume piles up, each new trade nudges the line less, so late-session VWAP can feel unresponsive. Anchored VWAP, which starts from a user-chosen point rather than the open, is one way analysts sidestep the daily reset.
Data quality matters as well. VWAP is only as representative as the volume feeding it. In fragmented markets such as crypto, where the same asset trades across many venues, a VWAP built from one exchange may not reflect the wider market. Thin or manipulated volume can distort the figure in any market.
How is VWAP used in crypto markets?
Because VWAP requires only price and volume, it transfers directly from equities to digital assets. Crypto markets add two wrinkles worth understanding. First, they trade continuously, twenty-four hours a day, so there is no single opening bell at which every venue resets; platforms choose their own anchor, often midnight in a reference time zone.
Second, the same coin trades across dozens of exchanges at once, each with its own volume. A VWAP drawn from one venue reflects only that venue’s activity, which is why some data providers publish an aggregated VWAP that blends volume from several exchanges. Anyone comparing VWAP figures across sources should check whether they are built from the same venues and the same anchor point.
What is anchored VWAP?
Anchored VWAP is a variation that begins the calculation from a specific event chosen by the user rather than from the session open. An analyst might anchor it to a major news release, a swing high or low, or the first trade of a newly listed asset, and the line then accumulates volume forward from that point.
The purpose is to measure the average traded price since a moment that matters, sidestepping the arbitrary daily reset of standard VWAP. Like the standard version, anchored VWAP is a descriptive benchmark. It summarises what has happened since the anchor and carries no built-in prediction about what follows.
The bottom line
VWAP is a volume-weighted snapshot of where an asset traded over a session: cumulative value divided by cumulative volume, reset each day. It is valued as an execution benchmark and a neutral fair-value reference, and it differs from TWAP mainly in weighting by volume rather than time. Because it is descriptive and backward-looking, VWAP is best understood as a measurement tool rather than a signal, and nothing here should be read as trading advice.
Sources
Frequently asked questions
Does VWAP reset every day?
Standard intraday VWAP resets at the start of each trading session and rebuilds through the day. Some charting tools also offer anchored VWAP, which starts from a chosen point such as an earnings date and runs forward until it is reset.
Is VWAP the same as a moving average?
No. A simple moving average weights each period's price equally, while VWAP weights each price by the volume traded there. That is why VWAP can sit far from a simple average when volume is concentrated at particular prices.
What is the difference between VWAP and TWAP?
VWAP weights prices by traded volume, so heavy-volume prices dominate. TWAP weights by time, splitting a benchmark or order evenly across intervals regardless of how much traded. TWAP is simpler and is often used in thin markets.
Can VWAP be used in crypto markets?
Yes. Because VWAP only needs price and volume data, it applies to stocks, futures, exchange-traded funds and cryptocurrencies. In crypto, volume can differ across venues, so a VWAP is only as representative as the data feeding it.
Is VWAP a buy or sell signal?
No. VWAP is a descriptive benchmark that summarises where trading occurred. It does not forecast direction, and using it to time trades is a strategy choice beyond the scope of this explainer, which covers mechanics only.
Related

Spot vs derivatives markets: the structural difference
Spot markets trade the actual asset for delivery; derivatives trade contracts on its price. The structural difference and why it…

Slippage: why you get a different price
Slippage is the gap between the price you expected and the price you got. Here is why slippage happens as…
What funding rates are and why they exist
Funding rates are recurring payments between traders that keep a perpetual future tethered to spot. What they are, why they…